What are moving averages?
Written by an ex-institutional trader. SMA versus EMA, the 200-day trend filter, the golden and death cross, pullbacks to a moving average and the whipsaw that catches everyone, each drawn step by step, plus a free printable cheat sheet.
Direct answer
A moving average smooths price into a single flowing line by averaging it over a set number of periods, making the underlying trend easier to see through the noise. The two main types are the simple moving average (SMA), which weights all periods equally, and the exponential moving average (EMA), which weights recent prices more heavily so it reacts faster. The period, such as 20, 50 or 200, sets how much it smooths.
Traders use moving averages to read trend direction (price above a rising average is bullish), as dynamic support and resistance, and through crossovers. The best-known crossover signals are the golden cross (a faster average crossing above a slower one, bullish) and the death cross (the reverse, bearish). Moving averages lag price because they are built from past data, so they confirm trends rather than predict turns, and work best with the trend rather than against it. A free one-page PDF cheat sheet with the formulas, periods, setups and a signals table is further down the page.
What a moving average is
A moving average smooths price into a single flowing line by averaging it over a set number of periods. As each new period closes, the oldest drops out and the newest is added, so the line moves along with price, hence the name. Its job is to strip out the short-term noise that clutters a raw price chart and make the underlying trend easier to see.
A 50-day moving average, for instance, plots the average of the last 50 daily closes. The longer the period, the smoother and slower the line; the shorter the period, the closer it hugs price and the faster it reacts. That single choice, the period, is the main lever you control.
Disclosure: SatoshiMacro may earn a commission if you open a broker account through links on this page, at no extra cost to you. See our full affiliate disclosure.
SMA vs EMA
There are two main types, and the difference is how they weight the prices in their window:
- Simple moving average (SMA): every period gets equal weight. Smoother and slower, it lags more but gives fewer false signals. Favoured for longer-term trend reading.
- Exponential moving average (EMA): recent prices get more weight, so it reacts faster and turns sooner. More responsive but noisier. Favoured by shorter-term traders.
The EMA's weighting comes from a multiplier of 2 divided by the period plus one. For a 20 EMA that is 2 / 21, about 0.095, so the latest close carries roughly 9.5 percent of the weight and older closes fade out gradually. A 20 SMA gives each of the last 20 closes exactly 5 percent and drops the oldest one completely.
- Price breaks out of a flat range. Both averages start flat and on top of each other.
- The EMA pulls ahead. During the rally the EMA sits above the SMA. The vertical gap is the extra responsiveness you pay for with more false turns.
- Price drops and the EMA turns first. The EMA is already falling while the SMA is still near its peak.
Neither is better. I use EMAs for pullback entries on shorter timeframes and simple averages for the slow trend lines, the 50 and 200, because that is what most of the market watches.
Golden cross and death cross
The best-known moving average signals are crossovers between a faster and a slower average, classically the 50 and the 200.
- Golden cross: the 50-period average crosses above the 200-period average, traditionally a bullish signal that a longer-term uptrend may be starting.
- Death cross: the 50 crosses below the 200, a bearish signal.
Both are lagging signals that confirm a trend already in motion rather than predicting one, so they are best treated as context for the bigger picture, not precise entries.
- Price bottoms. In this example the golden cross only prints 68 trading days after the low, with price already about 13 percent off the bottom.
- Price tops. The death cross follows 61 trading days after the high, by which point price is about 14 percent below the peak.
That lag is the trade-off. The cross filters out a lot of noise, but it will never get you in near the low or out near the high. Their value is partly self-fulfilling: so many traders and institutions watch the 50/200 relationship that it influences behaviour around those crosses.
How to use them
Three sound, common uses:
- Trend direction. Price above a rising average leans bullish; below a falling one leans bearish. This sets your bias before you look for an entry.
- Dynamic support and resistance. In a trend, price often pulls back to a moving average and bounces, giving an entry in the direction of the trend rather than against it.
- Crossovers. A faster average crossing a slower one flags a momentum shift, useful as confirmation alongside RSI or MACD.
All three play to the moving average's strength, reading and following trend, and all three need price confirmation and a defined risk rather than blind execution.
The 200-day as a trend filter
- Above a rising 200-day. The long-term trend is up. I only take long setups on that pair.
- The break. Price closes below the average. Right around the cross it flipped back and forth a few times inside a week, so I wait for the 200-day itself to flatten and turn before switching sides.
- Below a falling 200-day. Short setups only, or stand aside.
The filter does not tell you when to enter. It tells you which direction you are allowed to trade, which on its own removes a lot of bad trades.
Pullbacks to a moving average
- First pullback. Price dips to the 20 EMA and the next candles close higher. The average is acting as support.
- Second pullback. Price tags the average again and turns up. This is the entry: buy the bullish candle off the EMA, with the stop below the pullback low.
- Third pullback. Same pattern. The day price closes well below the EMA and the average flattens is the day the trend is in question.
On faster trends the 20 EMA works; on slower, grinding trends the 50 is usually the one price respects. Watch which one the pair has been bouncing from and use that.
Free moving averages cheat sheet
The page on one printable A4 sheet: the SMA and EMA formulas, what the common periods are used for, labelled diagrams of SMA versus EMA, the golden and death cross, a pullback to the 20 EMA and a whipsaw, a signals table, five rules of thumb and the three mistakes I see most often.
Moving averages cheat sheet
Free one-page PDF. Print it or keep it next to your charts. No signup.
Download the cheat sheet (PDF)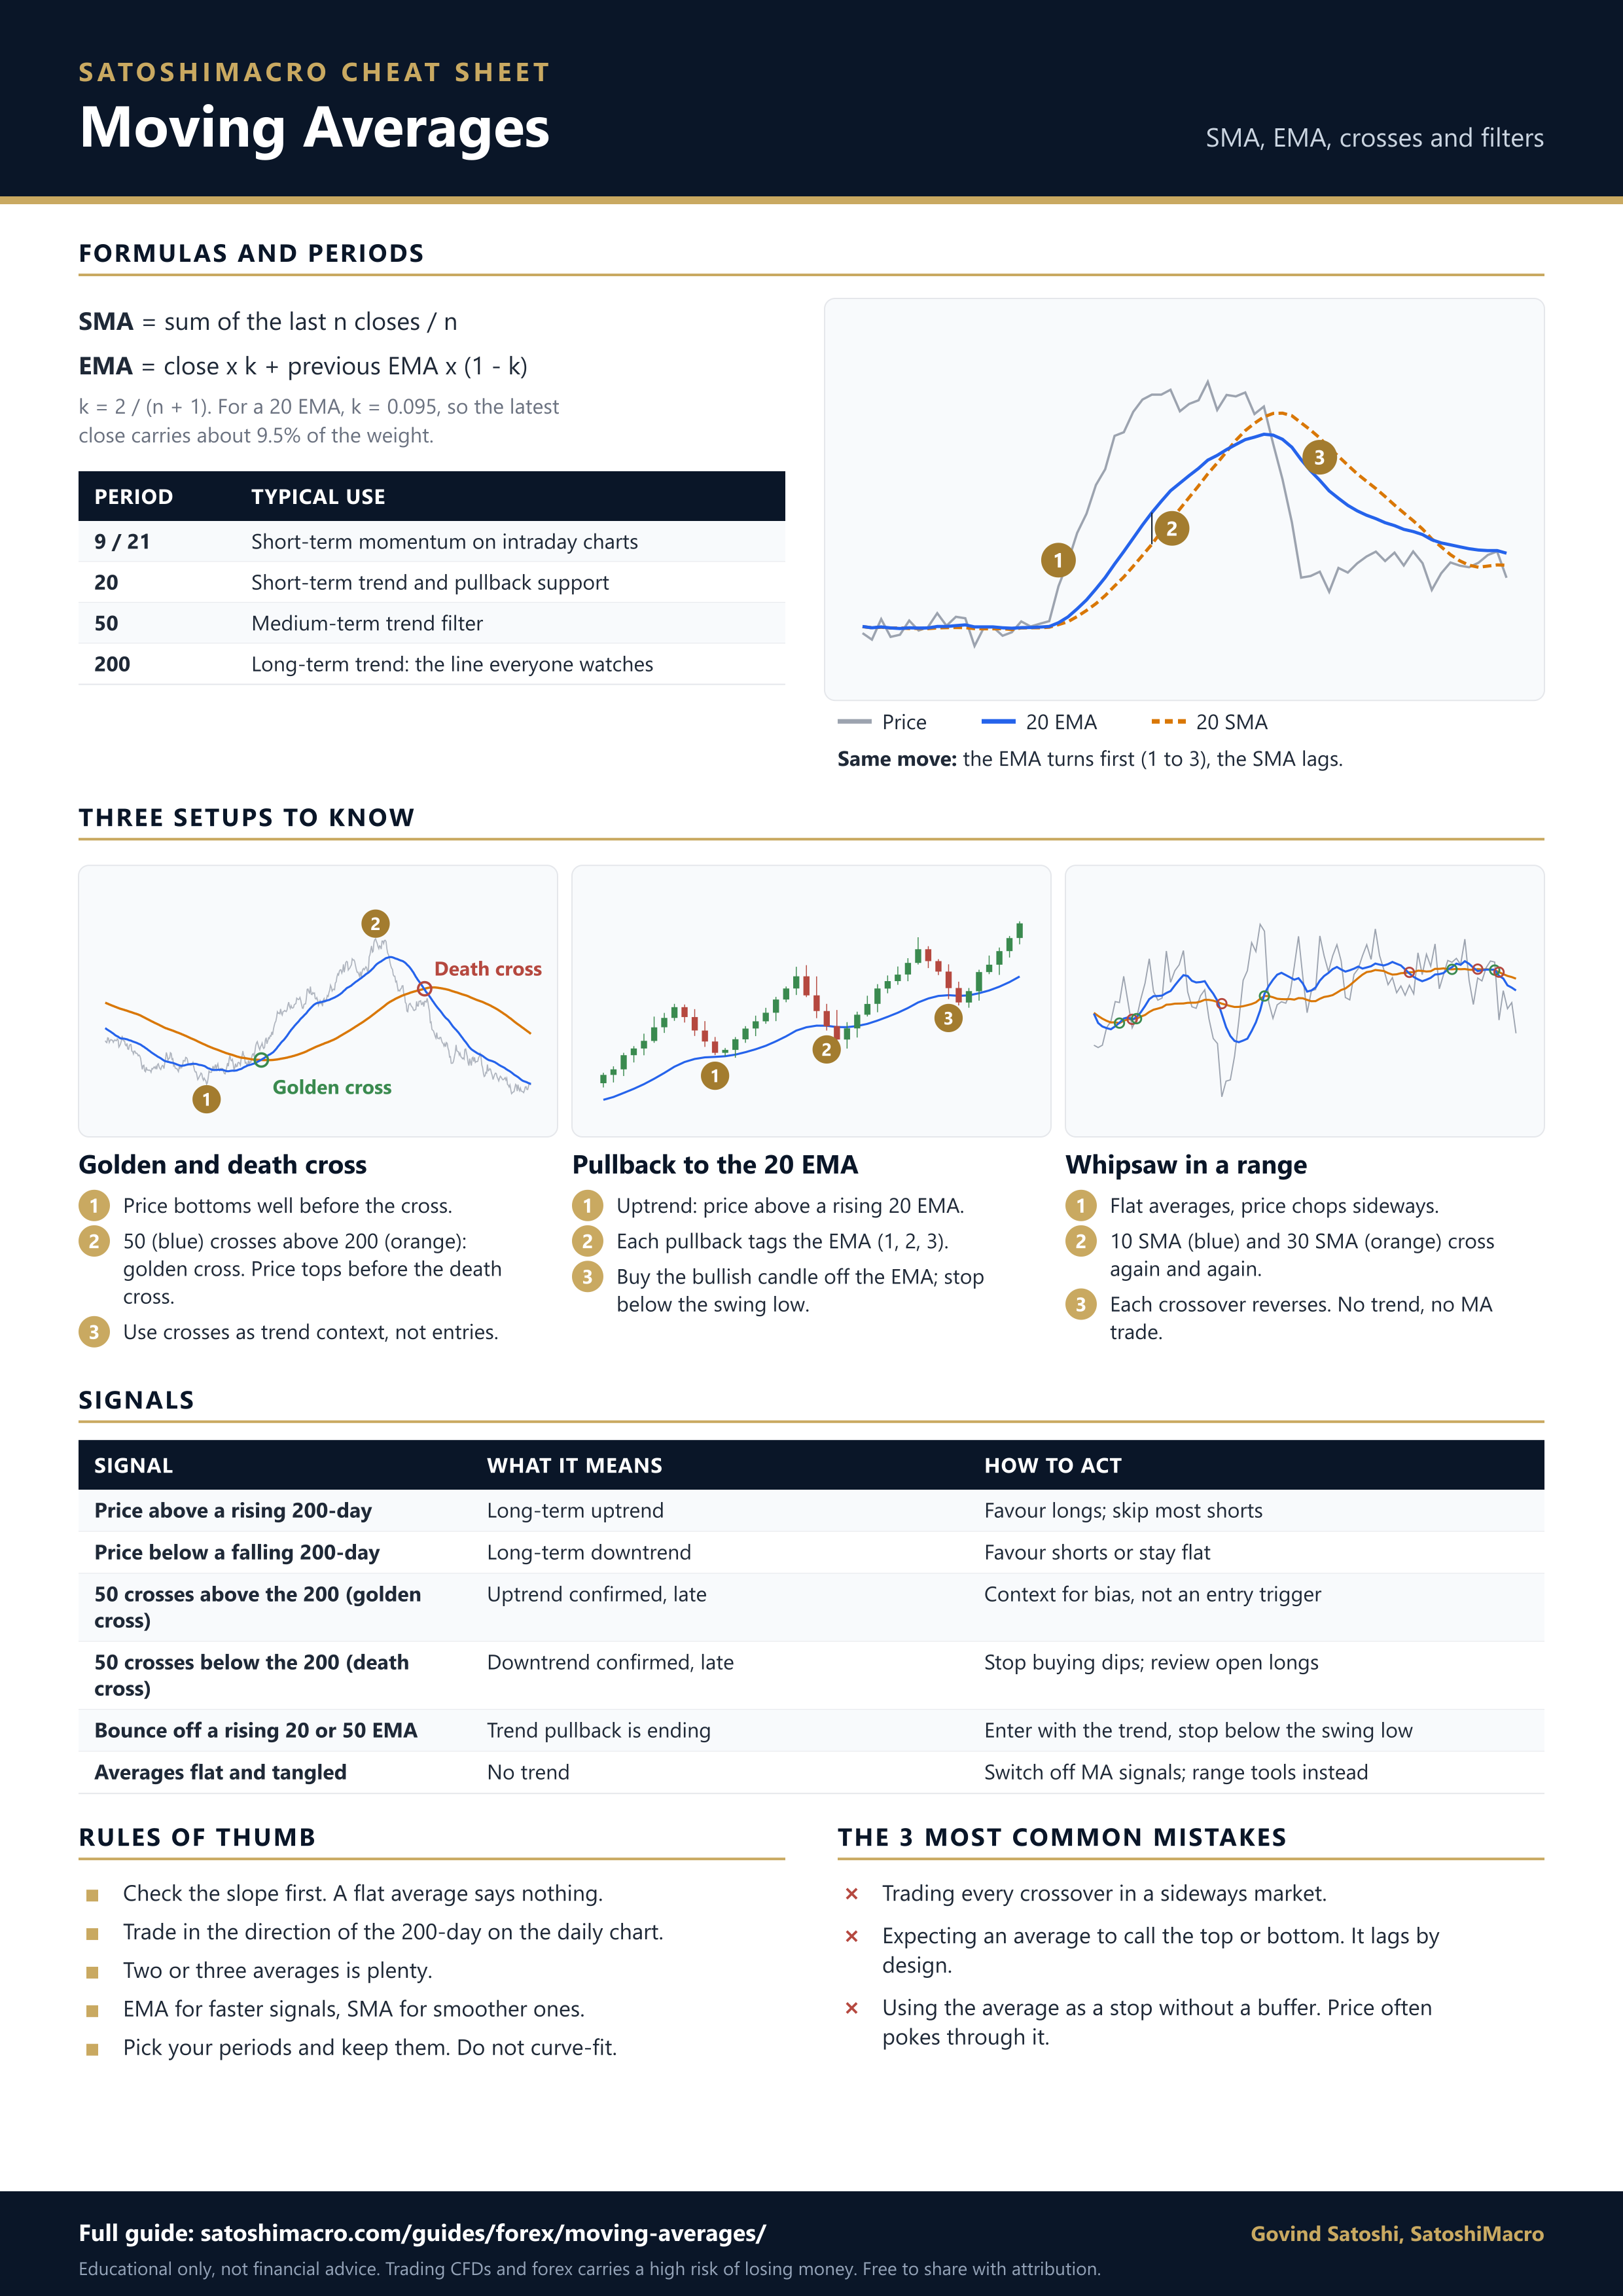
Common mistakes
The biggest limitation is easiest to see on a chart. Here is a sideways market with a 10 SMA and a 30 SMA on it:
Trade every one of those crossovers and you pay the spread 10 times to go nowhere. Flat, tangled averages are the market telling you there is no trend for a trend tool to follow.
The usual moving average errors:
- Trading crossovers in a range. In choppy markets, crossovers whipsaw endlessly. Moving averages are trend tools; they struggle sideways.
- Expecting them to predict. They lag by design. They confirm trends, they do not call tops and bottoms.
- Using too many. A chart buried in averages obscures more than it reveals. Two or three is plenty.
- Skipping risk control. The stop and position size protect the account, not the average.
Used with the trend and confirmed by price, moving averages are a reliable backbone for reading direction. Build the rest of the foundation with RSI, MACD and forex trading strategies, and choose a broker with full charting from the best forex brokers in Australia ranking.
Popular ASIC-regulated CFD brokers
All three are ASIC-regulated with free demo accounts. CFD Service. Your capital is at risk.
Diagrams are illustrative: simulated price data, with the moving averages calculated from it. Last reviewed: 2026-09-27.
Test your knowledge
A quick 3-question check on the key ideas above. Choose an answer for each, then check your score. Every answer is explained, and nothing is sent anywhere; it all runs in your browser.
Frequently asked questions
What is a moving average in trading?
A moving average is a line that smooths price by averaging it over a set number of periods, recalculated as each new period closes so the line moves along with price. It strips out short-term noise to make the underlying trend clearer. For example, a 50-day moving average plots the average of the last 50 daily closes. Traders use it to judge trend direction, to act as dynamic support or resistance, and to generate crossover signals. It is one of the oldest and most widely used tools in technical analysis.
What is the difference between SMA and EMA?
Both smooth price, but they weight it differently. A simple moving average (SMA) gives every period in its window equal weight, so it is smoother and slower to react. An exponential moving average (EMA) gives more weight to recent prices, so it reacts faster to new moves and turns sooner, at the cost of more false signals. Short-term traders often prefer the EMA for its responsiveness; longer-term traders often prefer the SMA for its stability. Neither is better in the abstract; they suit different timeframes.
What is a golden cross and a death cross?
They are the best-known moving average crossover signals, usually using the 50-period and 200-period averages. A golden cross is when the faster 50-period average crosses above the slower 200-period average, traditionally seen as a bullish signal that a longer-term uptrend may be starting. A death cross is the reverse, the 50 crossing below the 200, seen as bearish. Both are lagging signals that confirm a trend already underway rather than predicting it, so they are best used as context, not precise entry triggers.
What moving average periods should I use?
The most common periods are 20, 50, 100 and 200. The 200-period average is the classic long-term trend gauge, the 50 is a medium-term trend filter, and the 20 tracks short-term momentum. Day traders often use shorter averages like 9 and 21, while position traders lean on the 50 and 200. There is no single correct setting; pick periods that match your timeframe and use them consistently. Watching how price interacts with a widely used average like the 200 matters because so many traders watch it too.
How do you trade with moving averages?
Three common approaches. First, trend direction: price above a rising average suggests an uptrend, below a falling one suggests a downtrend, which sets your bias. Second, dynamic support and resistance: in a trend, price often pulls back to a moving average and bounces, offering an entry in the direction of the trend. Third, crossovers: a faster average crossing a slower one signals a momentum shift. All three work best with the trend and confirmed by price, never as standalone triggers, and always with a stop loss.
Is there a moving averages cheat sheet I can print?
Yes. This page has a free one-page moving averages cheat sheet as a PDF and a PNG, with no signup. It covers the SMA and EMA formulas, what the common 9, 20, 50 and 200 periods are used for, labelled diagrams of SMA versus EMA, the golden and death cross, a pullback to the 20 EMA and a whipsaw in a range, a signals table, five rules of thumb and the three most common mistakes. It prints on a single A4 page.
Do moving averages work in forex?
Yes, moving averages are widely used in forex and CFD trading to read trend and dynamic support across timeframes. Because currency pairs trend cleanly through interest-rate and macro cycles, trend-following tools like moving averages tend to suit them well. The 50 and 200 are watched closely on the daily charts of major pairs. As in any market they lag price and produce false signals in choppy ranges, so they work best aligned with the trend and combined with other signals and disciplined risk management.
