What is the RSI indicator?
Written by an ex-institutional trader. What the RSI (Relative Strength Index) is and how it is calculated, then each signal shown step by step on a price and RSI chart: the 70 and 30 levels, the trend trap and divergence. Ends with a free one-page cheat sheet to download.
Direct answer
The RSI, or Relative Strength Index, is a momentum indicator that measures the speed and size of recent price moves on a scale from 0 to 100, to judge whether an asset is overbought or oversold. A reading above 70 traditionally signals overbought (the move may be stretched and due a pause or pullback); a reading below 30 signals oversold (the fall may be overdone). It is one of the most widely used technical indicators in forex and CFD trading.
RSI is most useful as a confirmation tool, not a standalone buy or sell signal. In a strong trend it can stay overbought or oversold for a long time, so acting on the levels alone gets traders run over. Its higher-value signal is divergence, where price makes a new high or low that RSI does not, hinting the trend is weakening. Like every indicator, it works best combined with price structure and risk management, not on its own. The diagrams below walk through the calculation and each signal, and there is a free one-page RSI cheat sheet (PDF) to print.
What the RSI is
The RSI, or Relative Strength Index, is a momentum indicator that measures the speed and size of recent price moves on a scale from 0 to 100. Developed by J. Welles Wilder in 1978, it compares the average size of recent gains to recent losses to gauge how strong and how stretched a move is. It appears as a line in a separate panel below the price chart, swinging between 0 and 100.
The idea is simple: when buying has dominated and pushed RSI high, the move may be getting overextended; when selling has dominated and pushed it low, the fall may be overdone. RSI does not tell you direction on its own, it tells you about momentum, which is why it pairs naturally with support and resistance and candlestick patterns.
Disclosure: SatoshiMacro may earn a commission if you open a broker account through links on this page, at no extra cost to you. See our full affiliate disclosure.
How RSI is calculated
Your platform does the maths, so you never need to work RSI out by hand. Knowing what goes into the number still pays off, because it explains most of RSI's behaviour, including why it can sit near 70 for weeks.
Take the last 14 candles and treat each close-to-close change as either a gain or a loss. Add up the gains, add up the losses, and divide each total by 14 (all 14 periods, not just the number of up or down candles). That gives the average gain and the average loss. Divide one by the other and you have RS, the relative strength. The final step squeezes RS onto the 0 to 100 scale.
After that first reading, Wilder smoothed the averages instead of starting fresh each candle: the new average gain is the previous average gain times 13, plus the latest gain, divided by 14 (the same for losses). That smoothing is why RSI moves steadily and one big candle does not reset it. A few charting packages use a simple average instead, which is why two platforms can show slightly different RSI values on the same chart.
One number worth remembering: RSI only reaches 70 when average gains are more than 2.33 times average losses, and only drops to 30 when losses are more than 2.33 times gains. Those are genuinely lopsided stretches of trading, which is why the levels mean something.
Overbought and oversold
The two levels that matter most are 70 and 30, Wilder's original thresholds. Above 70, RSI is in overbought territory: momentum is strong and the move may be due a pause. Below 30, it is oversold: the decline may be overdone. The 50 midline separates bullish momentum (above) from bearish (below).
This is how I read the levels. RSI crossing above 70 tells you buyers are strong, which on its own is not a reason to sell. RSI turning back down through 70 tells you that strength is fading, which is the start of a case. Even then I want price to agree, with a bearish candle at resistance or a break of the last swing low, before I act. The same logic runs in reverse at 30.
The trend trap: overbought can stay overbought
The most expensive RSI habit I see is shorting every reading above 70. In a strong trend, RSI can tag 70 again and again while price keeps grinding higher.
Two things to take from this. First, the 50 line works as a trend filter: while pullbacks keep holding in the 40 to 50 area, the uptrend is intact, and buying those dips makes more sense than selling the highs. Second, in trends like this some traders move the thresholds out to 80 and 20 so that only real extremes register. In a downtrend, flip it: RSI tends to live between 20 and 60, and rallies that stall around 50 to 60 are where sellers step back in.
How traders use it
RSI is most valuable as a confirmation tool rather than a standalone signal. A few common, sensible uses:
- Confirming a reversal at a level. When price reaches support or resistance and RSI is also oversold or overbought, the two together are stronger than either alone.
- Reading the 50 midline for trend. RSI holding above 50 supports a bullish bias; below 50 supports a bearish one. Some trend traders use the midline rather than the 70/30 extremes.
- Filtering with the trend. In an uptrend, oversold RSI pullbacks can mark buying opportunities in the direction of the trend, which is safer than shorting overbought readings against it.
The thread through all of these is that RSI confirms an idea you already have from price; it rarely pays to trade on RSI alone.
Divergence: the higher-quality signal
The signal experienced traders value most from RSI is divergence, where price and RSI disagree.
- Bullish divergence: price makes a lower low, but RSI makes a higher low. The new low came on less selling force, hinting the downtrend is fading.
- Bearish divergence: price makes a higher high, but RSI makes a lower high. The new price high came on weaker momentum, hinting the uptrend is tiring.
Divergence is generally more reliable than the raw 70/30 levels because it speaks to the momentum behind a move rather than just its extremity. It still needs confirmation, a candlestick reversal or a level break, before acting. A warning from experience: divergence can repeat. In a strong trend you can see two or three bearish divergences in a row before the top actually arrives, which is why the trigger has to come from price, not from RSI.
Free RSI cheat sheet (PDF)
I put the working parts of this guide onto one A4 page: the formula and default settings, the four signals drawn on a chart, a table of what each signal means and how to act on it, five rules of thumb, and the three mistakes I see most often. Print it, or keep it open next to your charts.
RSI indicator cheat sheet
Free one-page PDF. Print it or keep it next to your charts. No signup.
Download the cheat sheet (PDF)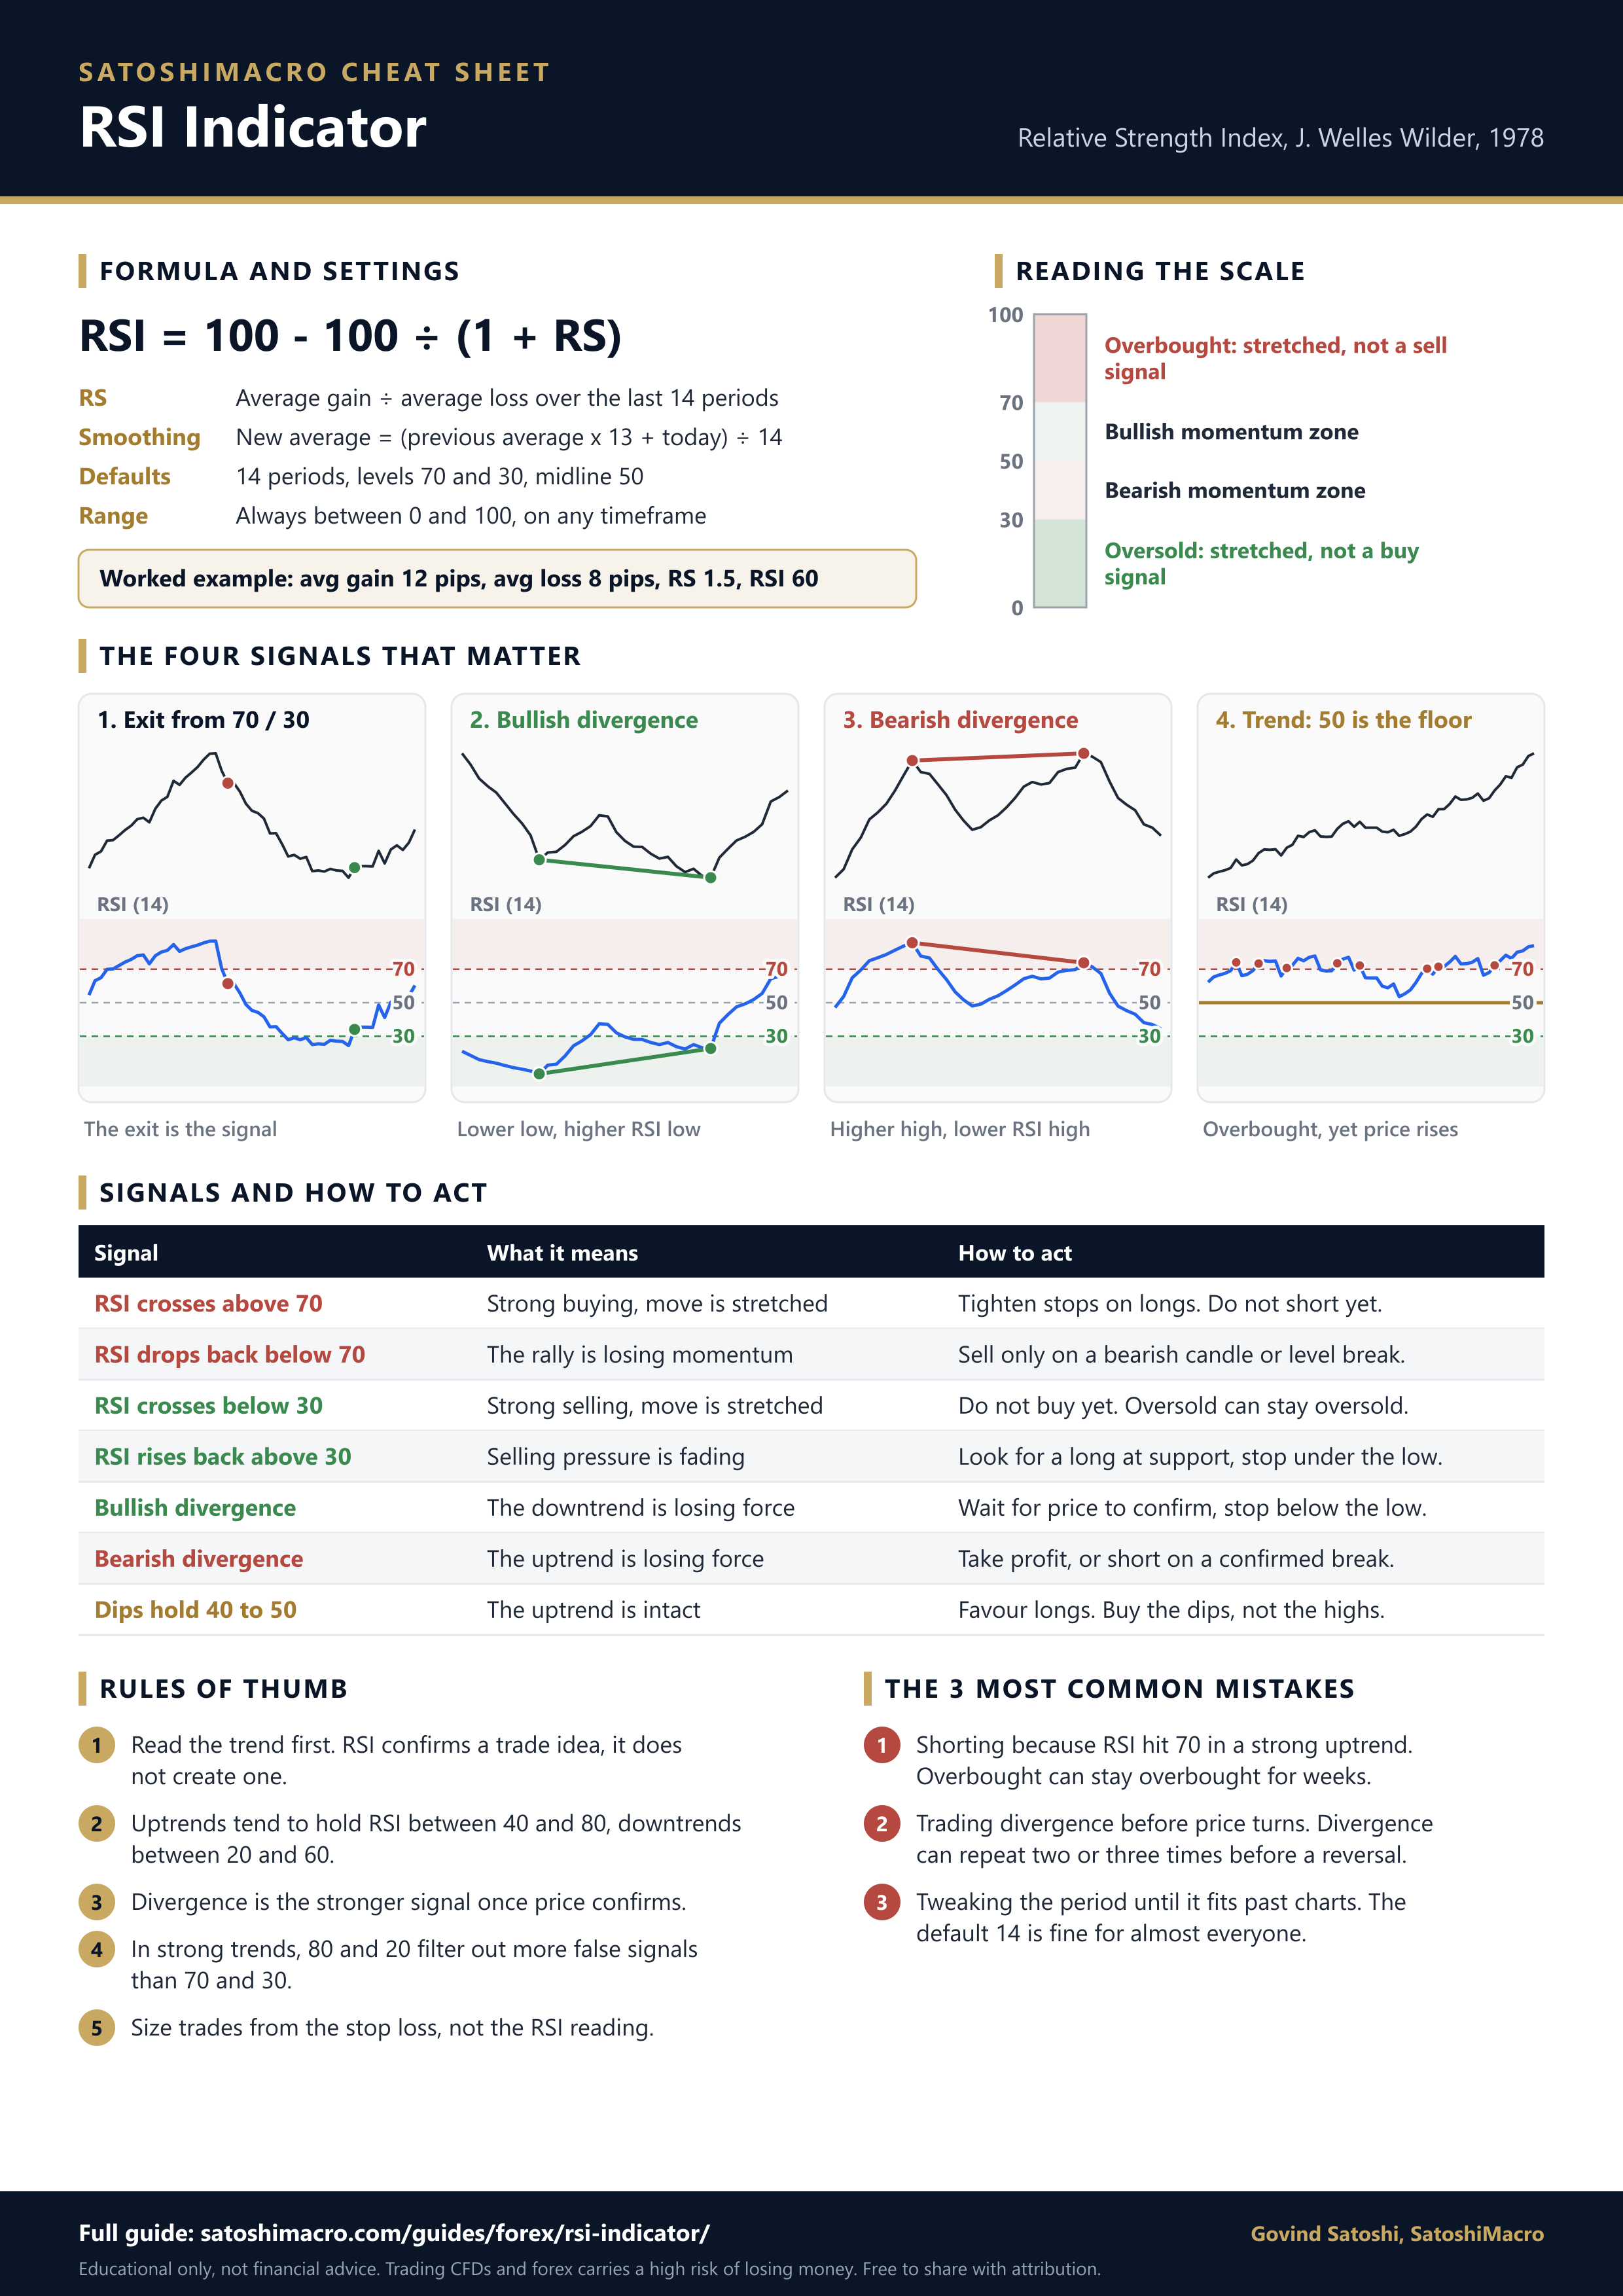
Common mistakes
Most RSI failures come from a handful of repeated errors:
- Selling every time RSI hits 70. In a strong trend this fights the move and bleeds the account. Overbought is a caution, not a sell button.
- Acting on divergence too early. Divergence can repeat before a turn. Wait for price to confirm it.
- Using RSI alone. No single indicator is enough. RSI needs the context of trend, structure and confirmation.
- Over-optimising the settings. Endlessly tweaking the period chases noise. The default 14 is fine for almost everyone.
- Ignoring risk management. The indicator does not protect the account; a stop loss and proper position size do.
Used as one input among several, with the trend and a defined risk, RSI earns its place. Build the rest of the foundation with candlestick patterns, support and resistance and forex trading strategies, and choose a broker with strong charting from the best forex brokers in Australia ranking.
Popular ASIC-regulated CFD brokers
All three are ASIC-regulated with free demo accounts. CFD Service. Your capital is at risk.
Diagrams are drawn from a simulated price series, with RSI calculated on that series using Wilder's 14-period method. Last reviewed: 2026-09-27.
Test your knowledge
A quick 3-question check on the key ideas above. Choose an answer for each, then check your score. Every answer is explained, and nothing is sent anywhere; it all runs in your browser.
Frequently asked questions
What is the RSI indicator in simple terms?
The RSI, or Relative Strength Index, is a momentum gauge that scores recent price action from 0 to 100. It compares the size of recent gains to recent losses to show how strong and stretched a move is. High readings mean buyers have been dominant and the asset may be overbought; low readings mean sellers have dominated and it may be oversold. It is shown as a line in a separate panel below the price chart, oscillating between 0 and 100, and is one of the most popular indicators in trading.
What is a good RSI level?
There is no single good level; it depends on what you are looking for. The traditional thresholds are 70 and 30: above 70 is considered overbought and below 30 oversold, with 50 acting as a midline that separates bullish from bearish momentum. Some traders tighten these to 80 and 20 to reduce false signals in trending markets, or use 60 and 40 in ranging markets. The level is a guide to momentum, not an automatic instruction to buy or sell.
Does RSI above 70 mean sell?
Not by itself. RSI above 70 means momentum is strong and the move may be stretched, but in a powerful uptrend RSI can stay above 70 for a long time while the price keeps rising. Selling purely because RSI hit 70 is one of the most common ways beginners fight a trend and lose. Treat overbought as a caution to watch for a reversal signal, such as a bearish candlestick or a break of support, rather than as a sell trigger on its own.
What is RSI divergence?
RSI divergence is when price and RSI disagree, which often warns that a trend is weakening. Bearish divergence is when price makes a higher high but RSI makes a lower high, suggesting the uptrend is losing momentum. Bullish divergence is the reverse: price makes a lower low but RSI makes a higher low, hinting the downtrend is fading. Divergence is generally a higher-quality RSI signal than the raw overbought and oversold levels, though it still needs confirmation before acting.
What RSI settings should I use?
The standard setting is a 14-period RSI, meaning it looks at the last 14 candles, which works on any timeframe and is what most charts default to. A shorter period, such as 7 or 9, makes RSI more sensitive and produces more signals, suiting short-term traders but generating more noise. A longer period, such as 21, smooths it for a slower, more reliable read. Most traders start with the default 14 and only change it once they understand how the sensitivity trade-off affects their style.
Is the RSI indicator reliable?
RSI is useful but not reliable as a standalone signal. Its weakness is that it can stay overbought or oversold for extended periods in a strong trend, so the levels alone produce many false signals. It works best as one input among several: combined with the trend direction, support and resistance, and candlestick confirmation, with divergence as its higher-quality signal. No indicator is reliable on its own, and RSI is no exception. Risk management, not the indicator, is what protects the account.
Is there a printable RSI cheat sheet?
Yes. This guide includes a free one-page RSI cheat sheet you can download as a PDF or PNG, with no signup. It covers the formula and default settings, the four RSI signals drawn on a chart, a table of what each signal means and how to act on it, five rules of thumb, and the three most common mistakes. It is sized for A4, so it prints cleanly and sits well next to a trading screen.
