What is the MACD indicator?
Written by an ex-institutional trader. What the MACD (Moving Average Convergence Divergence) is, how the line, signal and histogram are built, and each signal shown step by step on a price and MACD chart: crossovers, the zero line, range whipsaws and divergence. Ends with a free one-page cheat sheet to download.
Direct answer
MACD, short for Moving Average Convergence Divergence, is a momentum and trend indicator that tracks the relationship between two moving averages of price. It has three parts: the MACD line (the difference between a 12-period and 26-period exponential moving average), the signal line (a 9-period average of the MACD line), and the histogram (the gap between the two). It shows both the direction and the strength of momentum.
The most-watched signal is the crossover: when the MACD line crosses above the signal line, momentum is turning up (bullish); when it crosses below, momentum is turning down (bearish). The histogram shows that momentum building or fading in advance. Like all indicators, MACD lags price and produces false signals in choppy markets, so it works best with the trend, confirmed by price structure, and never as a standalone trigger. The diagrams below walk through each signal step by step, and there is a free one-page MACD cheat sheet (PDF) to print.
What the MACD is
MACD, short for Moving Average Convergence Divergence, is a momentum and trend indicator that tracks the relationship between two moving averages of price. Created by Gerald Appel in the late 1970s, it shows both the direction of momentum and how strong it is, in a panel below the price chart.
The core idea: when a faster moving average pulls away from a slower one, momentum is building in that direction; when they converge, momentum is fading. MACD packages that relationship into a form that is easy to read at a glance, which is why it sits alongside RSI as one of the two most popular momentum tools.
Disclosure: SatoshiMacro may earn a commission if you open a broker account through links on this page, at no extra cost to you. See our full affiliate disclosure.
The three parts
MACD has three components that work together:
- The MACD line: the 12-period exponential moving average (EMA) minus the 26-period EMA. This is the main momentum line.
- The signal line: a 9-period EMA of the MACD line, smoother and slower, used as a trigger.
- The histogram: the MACD line minus the signal line, drawn as bars around a zero line.
The diagram shows why this works. An EMA weights recent prices more heavily, so the 12 reacts faster than the 26. When price trends up, the 12 pulls above the 26 and the gap widens, so the MACD line rises. When the trend stalls, the 12 slows first and the gap narrows, so the MACD line flattens or turns down, sometimes while price is still edging higher.
One practical detail: MACD is measured in price units, not on a 0 to 100 scale like RSI. A MACD reading of 0.0020 on EUR/USD and 3.5 on gold are not comparable, and there is no fixed "overbought" level. What matters is the direction of the lines, where they sit relative to zero, and how they compare with their own recent history on the same chart.
Crossovers, step by step
When a downtrend turns into an uptrend, the MACD signals usually arrive in the same order. The diagram walks through a turn.
- The histogram shrinks. Price is still falling, but the MACD line has stopped pulling away from its signal line, so the red bars get shorter. Selling momentum is fading. This is an early warning, not an entry.
- The MACD line crosses above the signal line. The histogram flips from red to green. This is the classic bullish crossover. Here it came three candles after the low, which is about as good as it gets.
- The MACD line crosses above zero. The 12 EMA is now above the 26 EMA. By this point the move is well underway, which is the price you pay for confirmation.
A bearish turn runs the same sequence in reverse: green bars shrink, the MACD line crosses below the signal line, then below zero.
Crossovers carry more weight when they agree with the bigger picture: a bullish crossover above the zero line during an uptrend is stronger than one against the trend. Because MACD is built from moving averages, crossovers lag price, so they work best as confirmation of a move rather than as an early trigger.
Where MACD fails: sideways markets
The lag that makes MACD dependable in a trend is exactly what hurts it in a range. With no trend, the two averages keep weaving around each other and the crossovers arrive just as each small swing is ending.
My filter is simple. If the MACD line is hugging zero and price is trapped between obvious support and resistance, I ignore crossovers entirely and trade the range from the levels instead, or I stand aside.
Divergence
As with RSI, the higher-quality MACD signal is divergence, where price and MACD disagree.
- Bearish divergence: price makes a higher high but MACD makes a lower high, hinting the uptrend is tiring.
- Bullish divergence: price makes a lower low but MACD makes a higher low, hinting the downtrend is fading.
Divergence speaks to the momentum behind a move rather than the move itself, which makes it more telling than a raw crossover. It still needs confirmation from price, a candlestick reversal or a level break, before acting. The crossover that follows a divergence, as in the diagram, is a reasonable trigger for closing longs; for a new short I still want price to break the last swing low.
Free MACD cheat sheet (PDF)
Everything above fits on one A4 page: the three formulas and default settings, what each part tells you, the bullish sequence, bearish divergence and range whipsaw drawn on a chart, a table of signals with how to act on each, five rules of thumb and the three most common mistakes. Print it, or keep it open next to your charts.
MACD indicator cheat sheet
Free one-page PDF. Print it or keep it next to your charts. No signup.
Download the cheat sheet (PDF)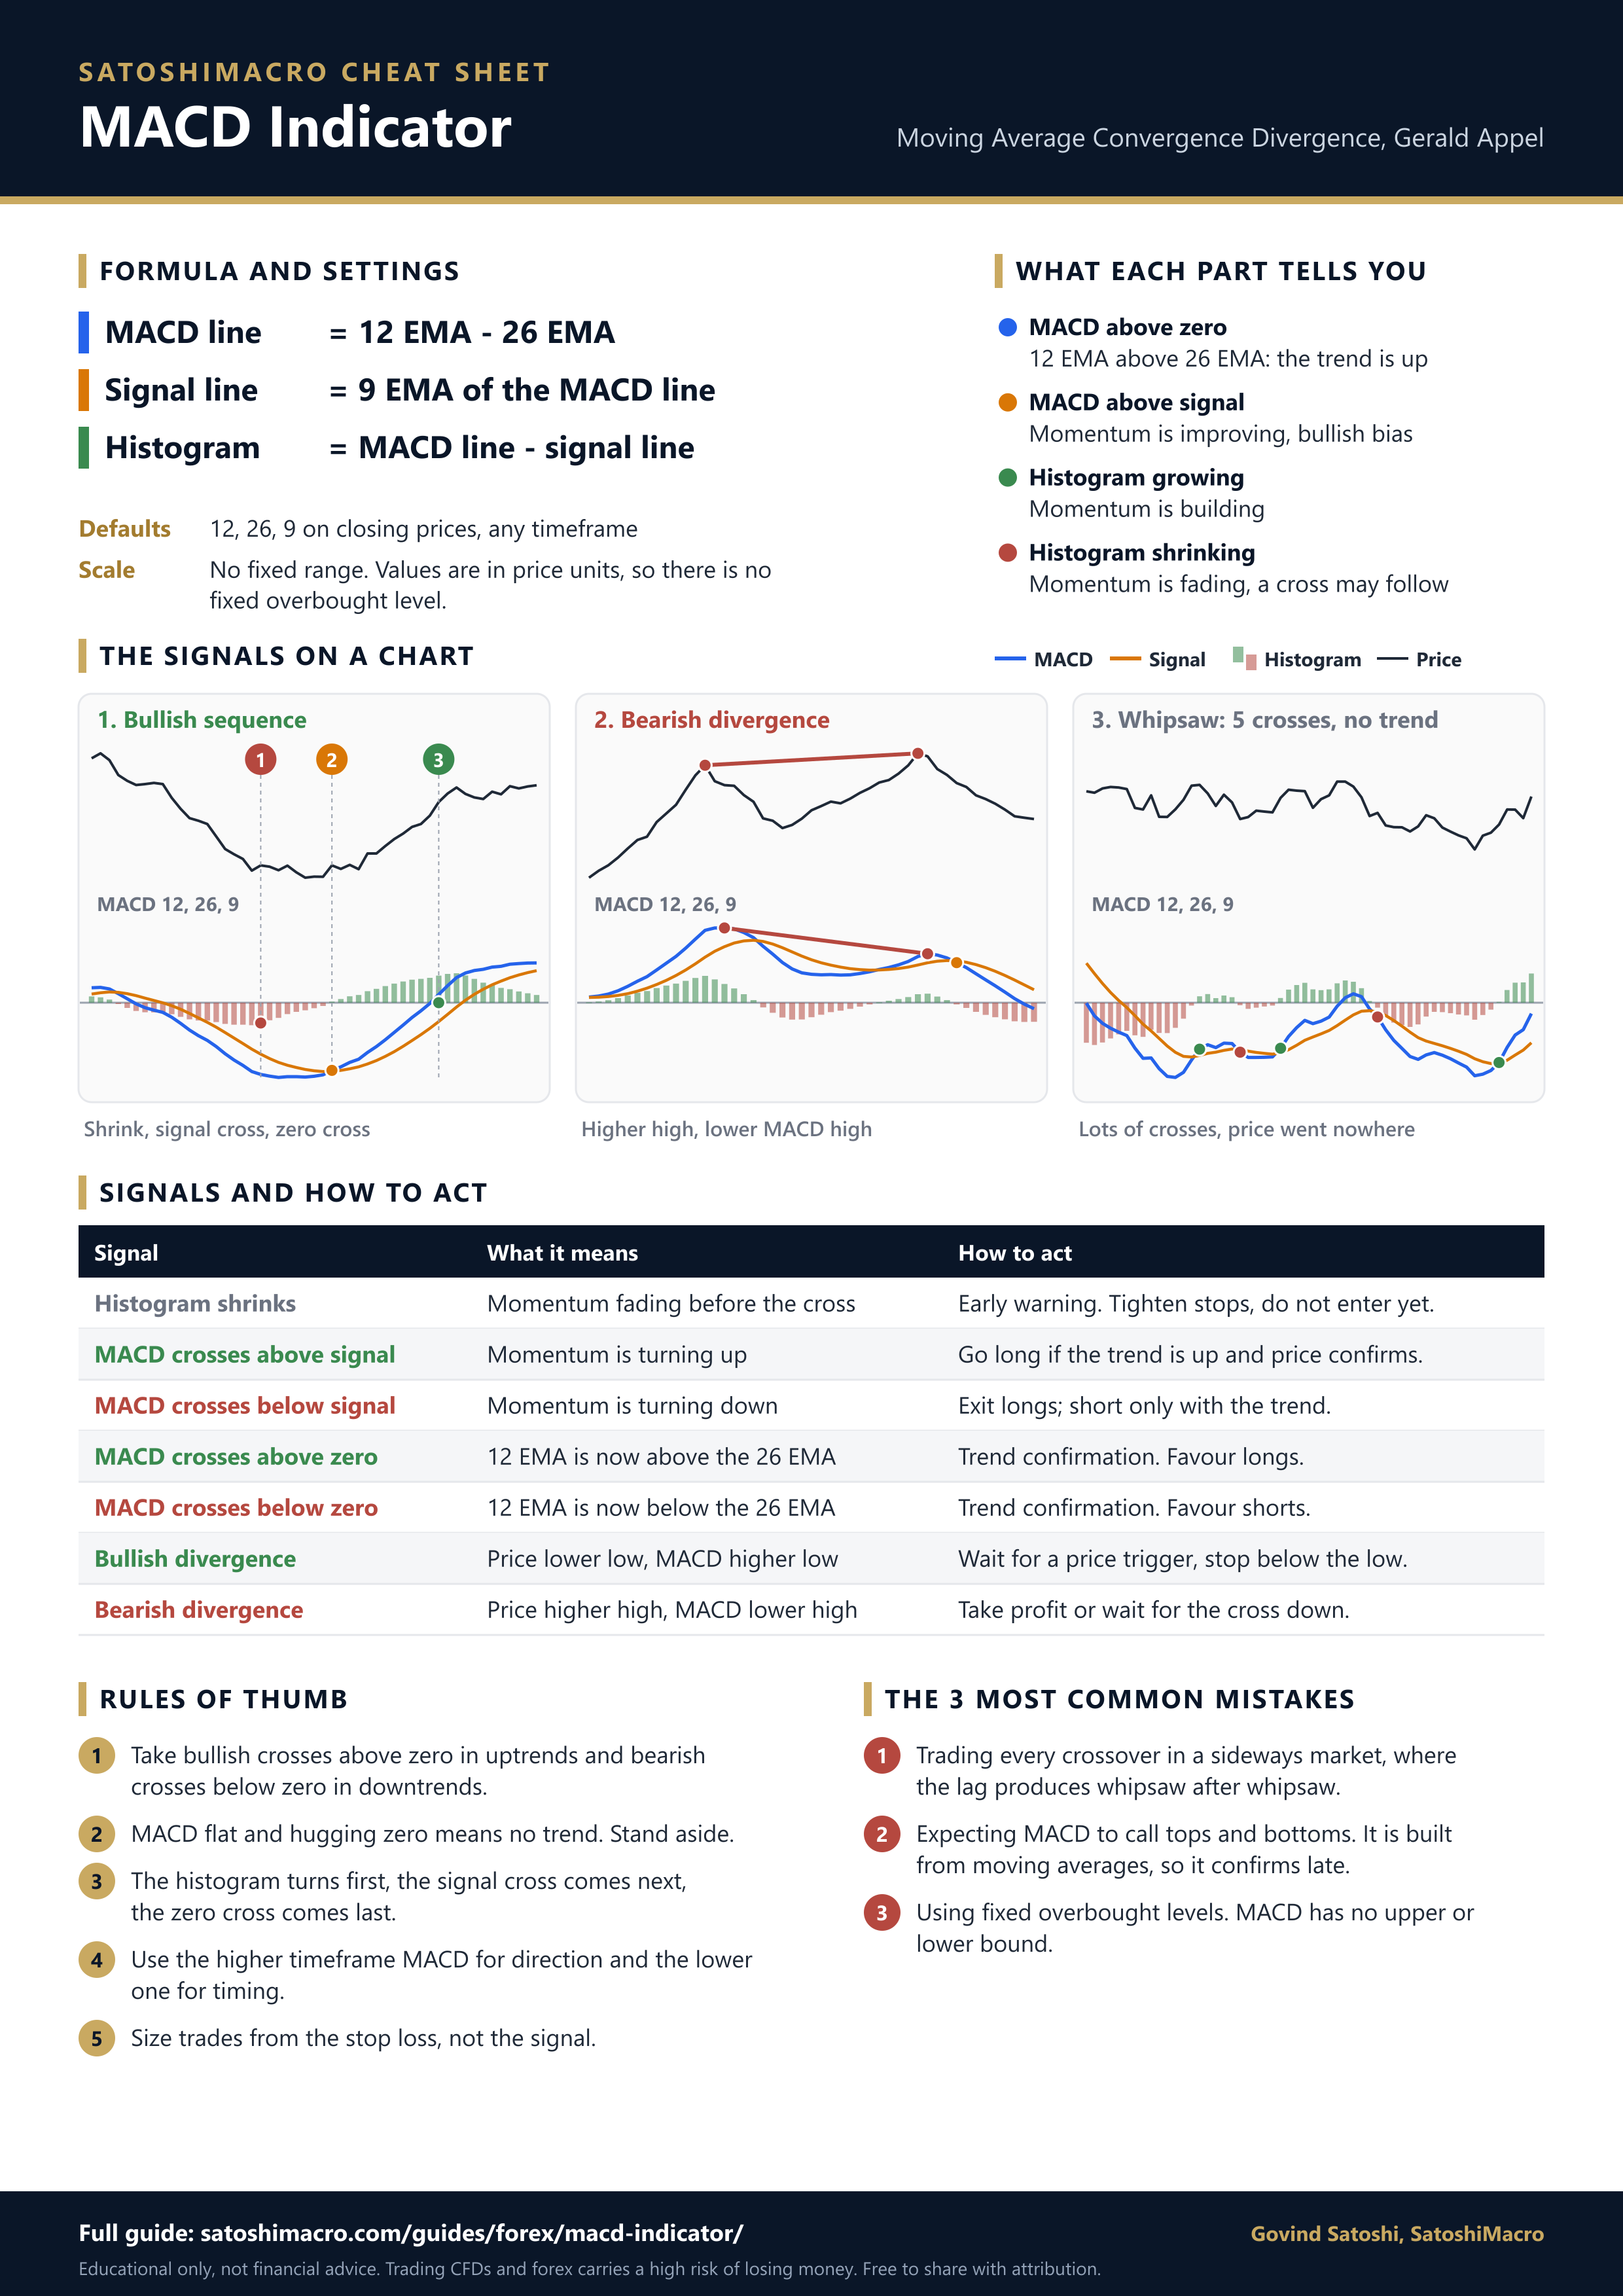
Common mistakes
The usual MACD errors:
- Trading every crossover. In a range, crossovers whipsaw constantly. Filter them with the trend and only take those aligned with it.
- Forgetting the lag. MACD confirms; it does not predict. Expecting it to call tops and bottoms leads to disappointment.
- Treating it like RSI. MACD has no fixed range, so there is no universal overbought level. A reading that looks extreme on one pair or timeframe means nothing on another.
- Using it alone. MACD needs the context of price structure and trend, not a chart of its own.
- Skipping risk control. The indicator does not size the trade or set the stop; a defined risk and position size do.
Used with the trend and confirmed by price, MACD is a solid momentum read. Build the rest of the foundation with RSI, moving averages and forex trading strategies, and pick a broker with full charting from the best forex brokers in Australia ranking.
Popular ASIC-regulated CFD brokers
All three are ASIC-regulated with free demo accounts. CFD Service. Your capital is at risk.
Diagrams are drawn from a simulated price series, with the 12, 26 and 9-period EMAs calculated on that series. Last reviewed: 2026-09-27.
Test your knowledge
A quick 3-question check on the key ideas above. Choose an answer for each, then check your score. Every answer is explained, and nothing is sent anywhere; it all runs in your browser.
Frequently asked questions
What is the MACD indicator in simple terms?
MACD, or Moving Average Convergence Divergence, is an indicator that measures momentum by comparing two moving averages of price. When the faster average pulls away from the slower one, momentum is strengthening; when they converge, it is fading. It is displayed as two lines plus a histogram in a panel below the price chart. Traders use it to spot when momentum is shifting direction, most commonly through the crossover of its two lines, which is why it is one of the most popular momentum indicators.
What is a MACD crossover?
A MACD crossover is when the MACD line crosses the signal line, the classic momentum signal. A bullish crossover is when the MACD line crosses above the signal line, suggesting upward momentum is taking over. A bearish crossover is when it crosses below, suggesting downward momentum. Crossovers above the zero line carry more weight in an uptrend, and below zero in a downtrend. Because MACD is built from moving averages, crossovers lag price and work better as confirmation than as a leading trigger.
What does the MACD histogram show?
The histogram is the gap between the MACD line and the signal line, drawn as bars around a zero line. When the bars are above zero and growing, bullish momentum is building; when they shrink, that momentum is fading even before the lines actually cross. Below zero, the same applies for bearish momentum. The histogram is effectively an early warning of a crossover, which is why many traders watch it closely for the moment momentum starts to turn.
What are the best MACD settings?
The standard settings are 12, 26 and 9: a 12-period and 26-period exponential moving average for the MACD line, and a 9-period average for the signal line. These defaults, set by Gerald Appel who created the indicator, work on any timeframe and are what almost all charts use. Shorter settings make MACD more sensitive and faster but noisier; longer settings smooth it out. Most traders should leave the defaults alone and focus on reading the signals in context rather than tuning the inputs.
What is MACD divergence?
MACD divergence is when price and the MACD disagree, often warning of a weakening trend. Bearish divergence is when price makes a higher high while MACD makes a lower high, suggesting the uptrend is losing momentum. Bullish divergence is when price makes a lower low while MACD makes a higher low, hinting the downtrend is fading. As with RSI, divergence is generally a higher-quality MACD signal than crossovers alone, though it still needs confirmation from price before acting on it.
Is MACD a leading or lagging indicator?
MACD is mainly a lagging indicator because it is built from moving averages, which are based on past prices, so its signals arrive after a move is underway. The histogram has a small leading quality, hinting at a turn before the lines cross, but the core crossover signals lag. This is why MACD performs well in trending markets, where catching a move slightly late still pays, and poorly in choppy ranges, where the lag produces repeated false signals. Pair it with the trend to play to its strength.
Is there a printable MACD cheat sheet?
Yes. This guide includes a free one-page MACD cheat sheet you can download as a PDF or PNG, with no signup. It covers the three MACD formulas and the default 12, 26, 9 settings, what each part tells you, the bullish crossover sequence, bearish divergence and range whipsaws drawn on a chart, a table of signals with how to act on each, five rules of thumb, and the three most common mistakes. It is sized for A4 so it prints cleanly.
