What are Bollinger Bands?
Written by an ex-institutional trader. How Bollinger Bands are built, then the squeeze, walking the band and the range fade, each drawn step by step, plus a free one-page cheat sheet you can print.
Direct answer
Bollinger Bands are a volatility indicator made of three lines: a middle moving average (usually 20 periods) and an upper and lower band set two standard deviations above and below it. The bands widen when volatility rises and narrow when it falls, so they show at a glance how active or quiet a market is, while wrapping around price to frame where it is trading relative to its recent range.
The most useful signals are the squeeze, when the bands narrow sharply and often precede a big move, and the way price tends to spend most of its time inside the bands. The classic beginner trap is treating a touch of the upper band as an automatic sell and the lower band as a buy; in a strong trend, price can ride a band for a long time. Bollinger Bands work best read alongside the trend and other signals, not as a standalone system. A free one-page PDF cheat sheet with the formulas, the three setups and a signals table is further down the page.
What Bollinger Bands are
Bollinger Bands are a volatility indicator developed by John Bollinger in the 1980s. They wrap three lines around price: a middle moving average, usually 20 periods, and an upper and lower band set two standard deviations above and below it. Because standard deviation measures how much price is moving, the bands automatically widen when volatility rises and narrow when it falls.
That gives two readings at once: how volatile the market is (band width) and where price sits relative to its recent range (its position between the bands). It is one of the most popular indicators precisely because it shows both in a single, intuitive picture.
Here is how the three lines are built. The middle band is a plain 20-period simple moving average of the closing price. Take the standard deviation of those same 20 closes, double it, and add it to the middle band for the upper band and subtract it for the lower band. That is the whole calculation.
Because the distance between the bands comes from standard deviation, you never have to adjust them for the pair or the timeframe. On a sleepy AUD/NZD daily chart or a fast gold 5-minute chart, the bands scale themselves to whatever the market is doing.
Disclosure: SatoshiMacro may earn a commission if you open a broker account through links on this page, at no extra cost to you. See our full affiliate disclosure.
The three bands
The diagram below shows the structure: a middle moving average with an upper and lower band that breathe in and out with volatility. Notice how the bands narrow during the quiet stretch (the squeeze) and widen as the move expands, with price spending most of its time inside them.
Roughly 90 percent of price action stays within the bands, which is why a move that pushes hard against or outside a band stands out: it signals an unusually strong push, which may either mark an extreme or, in a trend, confirm strength.
The squeeze
The squeeze is the signal Bollinger Bands are best known for. When the bands narrow sharply, volatility has dropped and the market has gone quiet, often coiling before a larger move. The logic is that markets cycle between low and high volatility, so an unusually tight squeeze tends to be followed by expansion.
- The squeeze forms. Band width falls to its lowest reading in months and the candles shrink. Nothing to trade yet, just a range to mark.
- Price closes outside a band. That close is the first real information about direction. Here it is a close above the upper band.
- The bands expand. Volatility returns, the bands flare apart and price keeps pressing the outer band in the direction of the break.
I measure the squeeze with band width rather than by eye, because a chart that has been quiet for weeks always looks tight. What matters is that it is tight relative to its own recent history.
The catch is that the squeeze does not tell you direction. It flags that a big move may be coming, not which way. Traders use it as a heads-up to prepare, then take the directional cue from the breakout itself and from other signals like the trend and momentum. Squeezes are especially useful in the quiet before a major economic release.
How to use them
A few sound ways to read the bands:
- Volatility context. Wide bands mean an active, possibly trending market; narrow bands mean a quiet one. This alone helps you pick the right strategy for conditions.
- Riding the band in a trend. In a strong uptrend, price walking up the upper band confirms strength rather than signalling a sell. The same applies in reverse for downtrends.
- Mean reversion in a range. In a sideways market with flat bands, touches of the upper and lower bands can mark the edges of the range, used the same way as support and resistance.
The right use depends entirely on whether the market is trending or ranging, which the band width itself helps you judge. The next two diagrams show both cases.
Walking the band in a trend
- Closes ride the upper band. This is strength. Selling here because price "touched the top" is how beginners end up short a trend.
- Pullbacks hold above the middle band. While that keeps happening the trend is intact, and those dips are where trend traders add.
- A close below the middle band. Momentum has faded. Not an automatic short, but it is time to tighten stops or take some profit.
Fading the edges of a range
- Price closes outside the lower band. On its own, that is just an extended move.
- The next candle closes back inside. That failed push is the signal. Enter on the close, with the stop a few pips beyond the extreme low.
- Target the middle band. In a range the 20 SMA is the natural first objective. Some traders hold part of the position for the opposite band.
The whole setup depends on the bands being flat. Run the same trade when the bands are wide and sloping and you are fading a trend, which is the quickest way to lose money with this indicator.
Free Bollinger Bands cheat sheet
Everything above on one printable A4 page: the band, band width and %B formulas, labelled diagrams of the squeeze, walking the band and the range fade, a signals table that says what each reading means and how to act on it, five rules of thumb and the three mistakes I see most often.
Bollinger Bands cheat sheet
Free one-page PDF. Print it or keep it next to your charts. No signup.
Download the cheat sheet (PDF)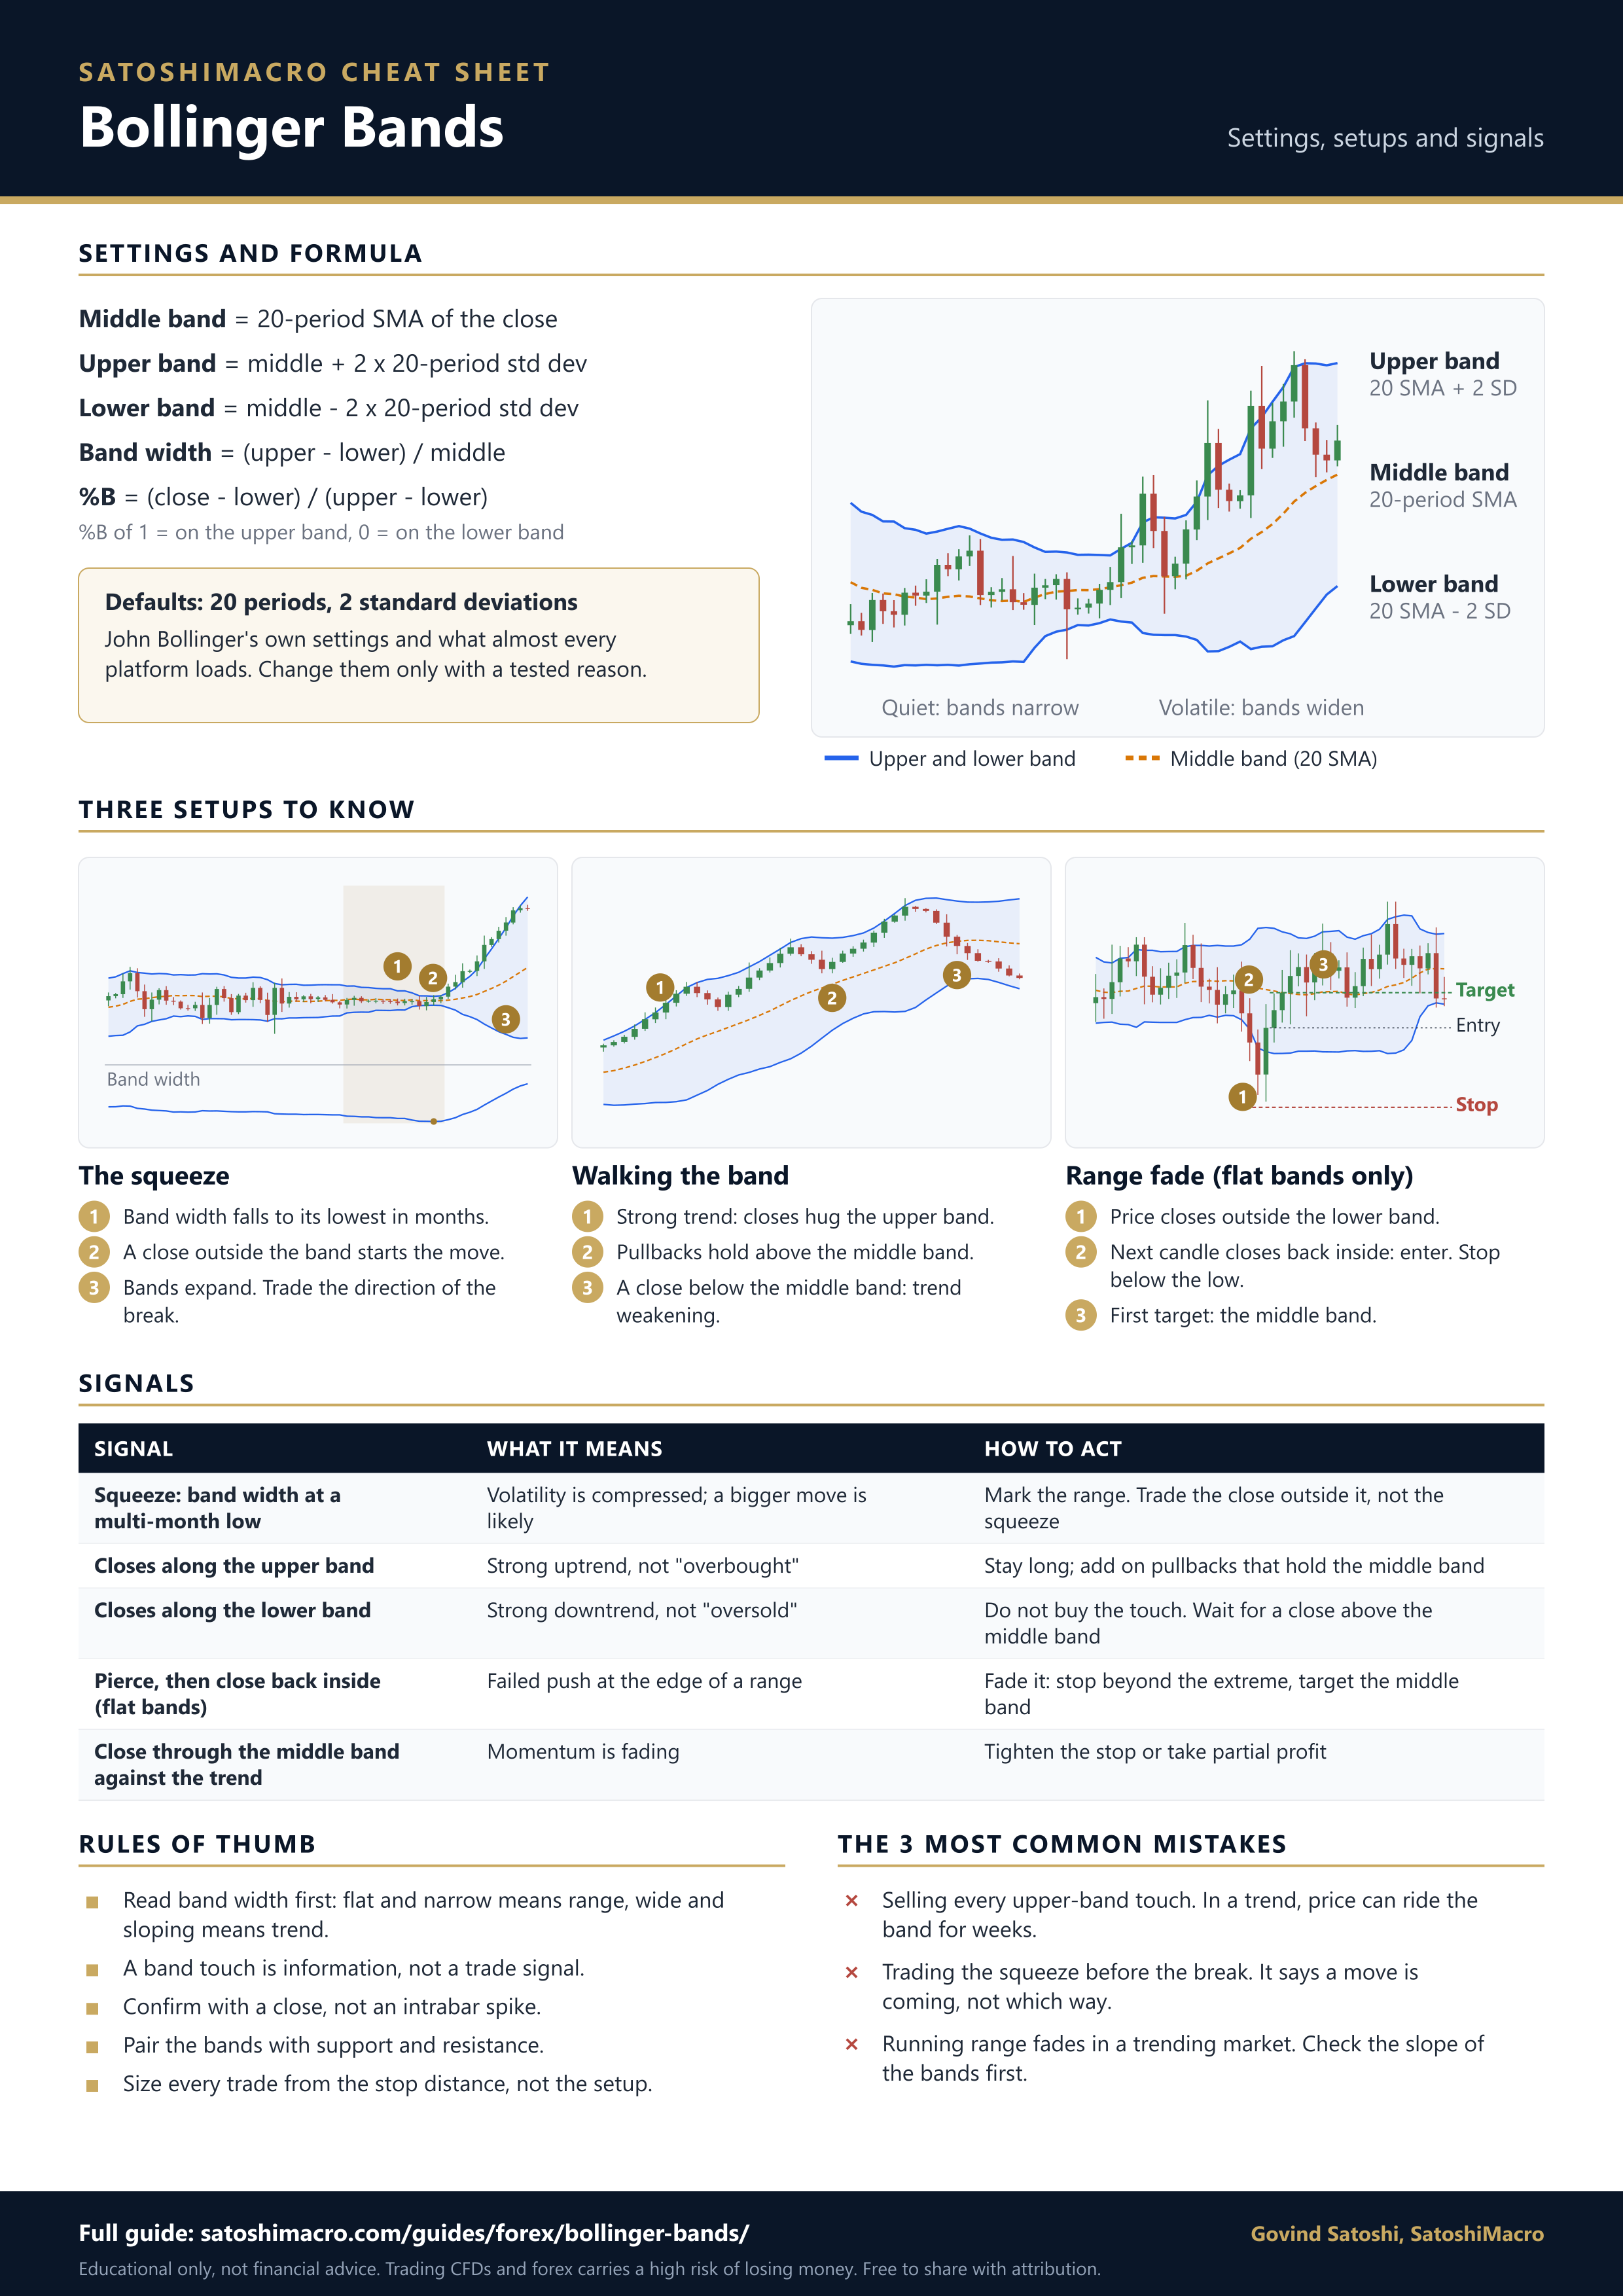
Common mistakes
The classic Bollinger Band errors:
- Selling every upper-band touch. In a trend, price rides the band. This is the single most common mistake and a direct way to fight a strong move.
- Trading the squeeze blind. A squeeze signals a move is likely, not its direction. Wait for the breakout.
- Ignoring the trend. Mean-reversion tactics work in ranges, not trends. Read band width to tell which you are in.
- Skipping risk management. As always, the position size and stop protect the account, not the indicator.
Read with the trend and confirmed by price, Bollinger Bands give a strong volatility read. Build the rest of the foundation with RSI, moving averages and support and resistance, and choose a broker with full charting from the best forex brokers in Australia ranking.
Popular ASIC-regulated CFD brokers
All three are ASIC-regulated with free demo accounts. CFD Service. Your capital is at risk.
Diagrams are illustrative: simulated price data, with the bands calculated from it using the standard 20-period, 2 standard deviation settings. Last reviewed: 2026-09-27.
Test your knowledge
A quick 3-question check on the key ideas above. Choose an answer for each, then check your score. Every answer is explained, and nothing is sent anywhere; it all runs in your browser.
Frequently asked questions
What are Bollinger Bands in simple terms?
Bollinger Bands are three lines plotted around price to show volatility and relative price level. The middle line is a moving average, usually 20 periods, and the upper and lower lines sit two standard deviations above and below it. Because standard deviation measures volatility, the bands widen when the market is moving a lot and narrow when it is quiet. They give a quick visual read of whether price is high or low relative to its recent range, and whether volatility is rising or falling.
What does the Bollinger Band squeeze mean?
A squeeze is when the bands narrow sharply because volatility has dropped, signalling a quiet, coiled market. Squeezes often precede a significant move, because periods of low volatility tend to be followed by high volatility, though the squeeze itself does not tell you which direction the breakout will go. Traders watch a squeeze as a heads-up that a big move may be coming and then take their directional cue from the breakout and other signals, not from the squeeze alone.
Should I sell when price hits the upper Bollinger Band?
Not automatically. A touch of the upper band means price is high relative to its recent range, but in a strong uptrend price can hug or ride the upper band for a long time while continuing to rise. Selling every upper-band touch is the most common Bollinger Band mistake and a good way to fight a trend. Band touches are better used as context, confirmed by the trend and a reversal signal, rather than as standalone buy or sell triggers.
What are the best Bollinger Band settings?
The standard settings, set by John Bollinger who created the indicator, are a 20-period simple moving average with bands at two standard deviations. These work across timeframes and markets and are what almost all charts default to. Some traders widen the deviation to 2.5 for less frequent signals or shorten the average for more sensitivity, but the defaults are well chosen and most traders should leave them alone and focus on reading the bands in context.
Do Bollinger Bands work in forex?
Yes, Bollinger Bands are widely used in forex and CFD trading because currency pairs move through clear cycles of high and low volatility that the bands capture well. The squeeze is especially useful around quiet periods before major economic releases, and band width gives a quick read of whether a pair is trending or ranging. As in any market, they work best combined with the trend and other tools rather than as a standalone signal, and always with defined risk.
Is there a Bollinger Bands cheat sheet I can print?
Yes. This page has a free one-page Bollinger Bands cheat sheet as a PDF and a PNG, with no signup. It covers the formulas for the middle band, the upper and lower bands, band width and %B, labelled diagrams of the squeeze, walking the band and the range fade, a signals table showing what each reading means and how to act on it, five rules of thumb and the three most common mistakes. It prints on a single A4 page.
What is the difference between Bollinger Bands and Keltner Channels?
Both wrap bands around a moving average, but they measure width differently. Bollinger Bands use standard deviation, so they expand and contract with volatility, which makes the squeeze possible. Keltner Channels use average true range, which tends to make them smoother and less reactive. Some traders combine the two, watching for when the narrower Bollinger Bands pull inside the Keltner Channels as a stricter squeeze signal. For most traders, standard Bollinger Bands alone are enough to start.
