What is Fibonacci retracement?
Written by an ex-institutional trader. How to draw Fibonacci retracement, then a 61.8 percent pullback trade, confluence and extension targets, each drawn step by step with worked AUD/USD numbers, plus a free printable cheat sheet.
Direct answer
Fibonacci retracement is a tool that marks potential support and resistance levels where a price pullback might end, drawn as horizontal lines at key percentages of a prior move: 23.6, 38.2, 50, 61.8 and 78.6 percent. You anchor it between a swing low and a swing high, and it plots the levels that price may retrace to before resuming the trend. The 38.2 to 61.8 percent band, especially 61.8 (the golden ratio), is watched most closely.
The levels come from the Fibonacci number sequence, and while there is no mechanical reason markets must respect them, they work partly because so many traders watch the same levels that orders cluster there. Fibonacci retracement is best used as confluence, lining up with existing support and resistance, a trendline or a moving average, rather than on its own. It identifies where a pullback might end, not a guarantee that it will. A free one-page PDF cheat sheet with the levels, the setups and a signals table is further down the page.
What it is
Fibonacci retracement is a tool that marks potential support and resistance levels where a price pullback might end before the trend resumes. After a strong move, price rarely continues in a straight line; it pulls back part of the way first. Fibonacci retracement estimates how far that pullback might go, drawing horizontal lines at set percentages of the prior move.
The percentages come from the Fibonacci number sequence, a mathematical series that appears throughout nature. Whether markets respect them for any deep reason is debatable, but the levels are watched so widely that they often behave as real support and resistance, partly because so many traders act on them at once.
Disclosure: SatoshiMacro may earn a commission if you open a broker account through links on this page, at no extra cost to you. See our full affiliate disclosure.
The levels
The key retracement levels are 23.6, 38.2, 50, 61.8 and 78.6 percent. The 38.2, 50 and 61.8 percent levels matter most, with 61.8 percent, the golden ratio, the most significant. The 38.2 to 61.8 percent band is often called the golden zone.
The 50 percent level is not strictly a Fibonacci number, but it is included by convention because markets so often retrace about half of a move.
The others all come from the same ratio. Divide any number in the Fibonacci sequence by the next one and you get close to 0.618. Square it and you get 0.382, cube it and you get 0.236, and its square root is 0.786. So 23.6, 38.2, 61.8 and 78.6 are one idea expressed four ways, and 50 is the odd one out.
How to draw it
You anchor the tool between two points, a clear swing low and swing high:
- In an uptrend, anchor from the swing low to the swing high. The levels plot below the high, showing where a pullback might find support.
- In a downtrend, anchor from the swing high to the swing low. The levels show where a bounce might find resistance.
The whole tool is only as good as the swings you choose, so pick obvious, significant turning points that other traders would also see. Most platforms have the Fibonacci tool built in; the skill is in the selection of the anchors, not the drawing.
- Click the swing low. Here AUD/USD bottoms at 0.6500 before a clean rally.
- Drag to the swing high. The rally tops at 0.6700, a 200-pip move. The tool now plots each level as the high minus that share of the move.
The arithmetic is simple enough to check by hand: 61.8 percent of 200 pips is about 124 pips, so the 61.8 level sits at 0.6700 minus 0.0124, or 0.6576. The 50 percent level is 0.6600 and the 38.2 percent level is 0.6624. If your platform shows different numbers, you anchored to different candles.
How traders use it
The standard use is timing an entry within a trend. After an impulse move, a trader waits for price to pull back into the golden zone (38.2 to 61.8 percent) and looks for a confirmation signal there to enter in the direction of the trend, with a stop just beyond the next level.
- Price pulls back to 61.8 percent. It trades down to 0.6571, a few pips through the 0.6576 level. Levels are zones, not exact prices.
- A bullish engulfing candle confirms. The entry is a buy stop just above its high at 0.6610. The stop goes below the 78.6 percent level at 0.6538, so the risk is 72 pips.
- Targets. The swing high at 0.6700 is 90 pips away, about 1.25 times the risk. The 127.2 percent extension at 0.6754 is 144 pips, 2 times the risk.
Doing that arithmetic before the entry is the point. If the first target is less than the risk, I pass on the trade, however good the candle looks.
Confluence: when two methods agree
Its real power is confluence. A Fibonacci level on its own is weak; a Fibonacci level that lines up with existing support or resistance, a trendline, or a moving average is far stronger, because several methods point to the same price. That stacking of signals, confirmed by a candlestick reversal, is how Fibonacci earns its place.
- Old resistance forms. Price stalls at 0.6600 three times. Sellers are clearly sitting there, and it is a round number too.
- The breakout. Price clears 0.6600 and runs to 0.6700. Old resistance often turns into support once it breaks.
- The pullback lands on both. The 50 percent retracement of the 0.6500 to 0.6700 swing is exactly 0.6600. Two independent reasons for buyers to show up at one price is the kind of level I would actually trade.
Extensions for targets
Retracements tell you where a pullback might end. Extensions answer the next question: if the trend resumes, where might it run to? The two standard extension levels are 127.2 and 161.8 percent of the original swing, measured from the swing low, which puts them above the swing high in an uptrend.
- The pullback holds the 61.8 percent level. The trend is still intact.
- First target, 127.2 percent at 0.6754. That is 0.6500 plus 1.272 times the 200-pip swing. A sensible place to take partial profit.
- Second target, 161.8 percent at 0.6824. That is 0.6500 plus 1.618 times the swing. The remainder of the position comes off here or trails a stop behind it.
Platforms label extensions differently. Some show them as 1.272 and 1.618, some as negative retracements (-27.2 and -61.8), and on some the direction you drag the tool decides where they appear. Check the price the platform prints, not only the label.
Free Fibonacci retracement cheat sheet
The whole page on one printable A4 sheet: how to draw the tool, the levels with where each ratio comes from and the AUD/USD example prices, labelled diagrams of the 61.8 percent pullback, confluence and extensions, a signals table, five rules of thumb and the three mistakes I see most often.
Fibonacci retracement cheat sheet
Free one-page PDF. Print it or keep it next to your charts. No signup.
Download the cheat sheet (PDF)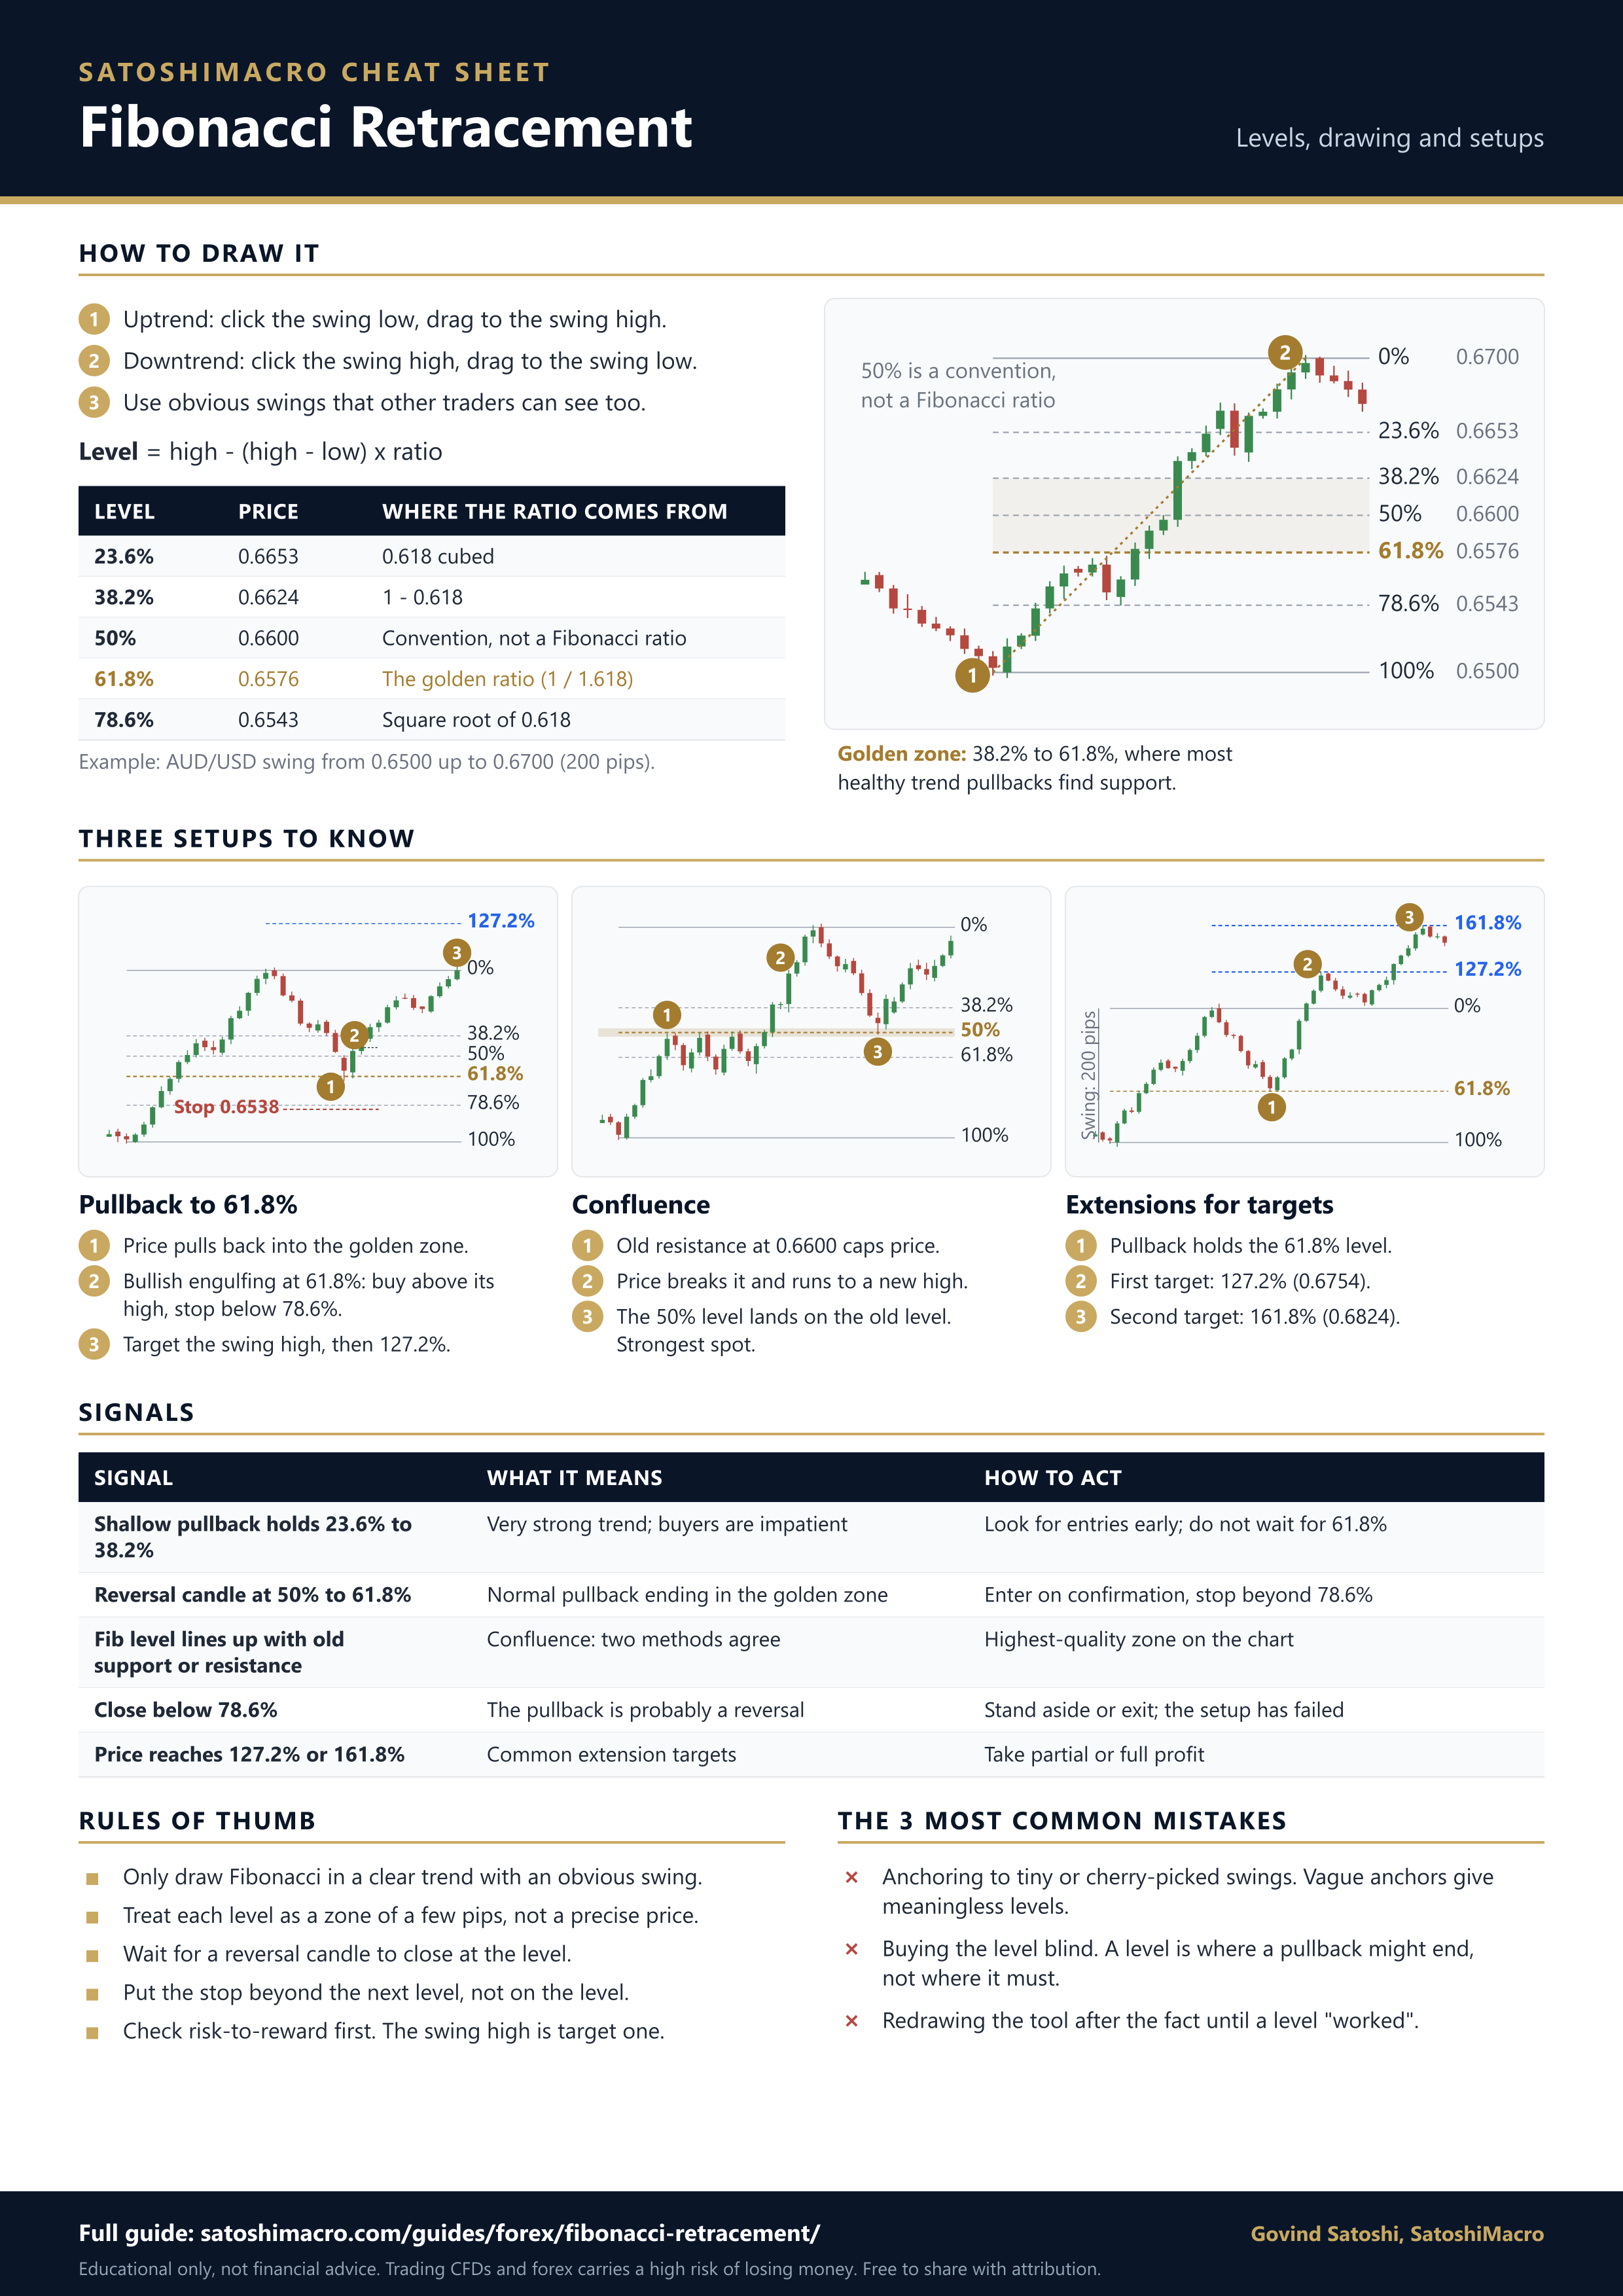
Common mistakes
The usual Fibonacci errors:
- Anchoring to unclear swings. Vague or cherry-picked swing points produce meaningless levels. Use obvious turning points.
- Treating levels as guarantees. They mark where a pullback might end, not where it must. Wait for confirmation.
- Using it in isolation. Fibonacci is a confluence tool. On its own, it is just lines on a chart.
- Ignoring risk management. A stop and proper position size protect the account when a level fails, which it regularly will.
Used as confluence and confirmed by price, Fibonacci retracement is a useful way to time entries within a trend. Build the rest of the foundation with support and resistance, moving averages and forex trading strategies, and choose a broker with full charting from the best forex brokers in Australia ranking.
Popular ASIC-regulated CFD brokers
All three are ASIC-regulated with free demo accounts. CFD Service. Your capital is at risk.
Diagrams are illustrative: simulated AUD/USD-style price data, with the Fibonacci levels calculated from the marked swing. Last reviewed: 2026-09-27.
Test your knowledge
A quick 3-question check on the key ideas above. Choose an answer for each, then check your score. Every answer is explained, and nothing is sent anywhere; it all runs in your browser.
Frequently asked questions
What is Fibonacci retracement in simple terms?
Fibonacci retracement is a tool that marks where a price pullback might end before the trend resumes. After a strong move, price rarely goes straight on; it pulls back part of the way first. The tool draws horizontal lines at set percentages of that move, 23.6, 38.2, 50, 61.8 and 78.6 percent, and traders watch those lines as potential support or resistance where the pullback could stall and the trend continue. You draw it by anchoring between a swing low and a swing high.
What are the main Fibonacci retracement levels?
The key levels are 23.6, 38.2, 50, 61.8 and 78.6 percent. The 38.2, 50 and 61.8 percent levels are the most watched, with 61.8 percent, derived from the golden ratio, considered the most significant. The 50 percent level is not technically a Fibonacci number but is included by convention because markets often retrace about half a move. The 38.2 to 61.8 percent band is sometimes called the golden zone, the area where many trend pullbacks find support or resistance.
How do you draw Fibonacci retracement?
You anchor the tool between two points: a swing low and a swing high of the move you are analysing. For an uptrend, click the swing low first and drag to the swing high; the levels then plot between them, showing where a pullback might find support. For a downtrend, go from the swing high to the swing low. Most charting platforms have the tool built in. The key skill is choosing clear, significant swing points, because the levels are only as good as the move you anchor them to.
Does Fibonacci retracement actually work?
It works often enough to be useful, but not because of any mechanical law. Part of the reason is self-fulfilling: so many traders draw the same levels from the same obvious swings that orders cluster around them, which makes the levels act as real support and resistance. It works best as confluence, when a Fibonacci level lines up with existing support, a trendline or a moving average, rather than in isolation. Treated as a guarantee, it disappoints; treated as one input among several, it adds value.
What is the golden zone in Fibonacci?
The golden zone, sometimes called the optimal trade entry, is the area between the 38.2 and 61.8 percent retracement levels, with particular attention on 61.8 percent. It is where many trend pullbacks find support or resistance before the trend resumes, making it a favoured area to look for entries in the direction of the trend. As with all Fibonacci levels, the zone is a place to watch for a confirmation signal, such as a candlestick reversal, not an automatic entry on its own.
Is there a Fibonacci retracement cheat sheet I can print?
Yes. This page has a free one-page Fibonacci retracement cheat sheet as a PDF and a PNG, with no signup. It shows how to draw the tool, a table of the 23.6, 38.2, 50, 61.8 and 78.6 percent levels with where each ratio comes from and a worked AUD/USD example, labelled diagrams of the 61.8 percent pullback, confluence and extension targets, a signals table, five rules of thumb and the three most common mistakes. It prints on a single A4 page.
Is Fibonacci retracement good for forex?
Yes, Fibonacci retracement is popular in forex and CFD trading because currency pairs trend and pull back cleanly, giving clear swings to anchor between. The major pairs are watched by enough traders that the common levels attract real order flow. As in any market, it works best as confluence with support and resistance, trendlines or moving averages, and confirmed by price action, rather than as a standalone signal. Combined with disciplined risk management, it is a useful tool for timing entries within a trend.
